
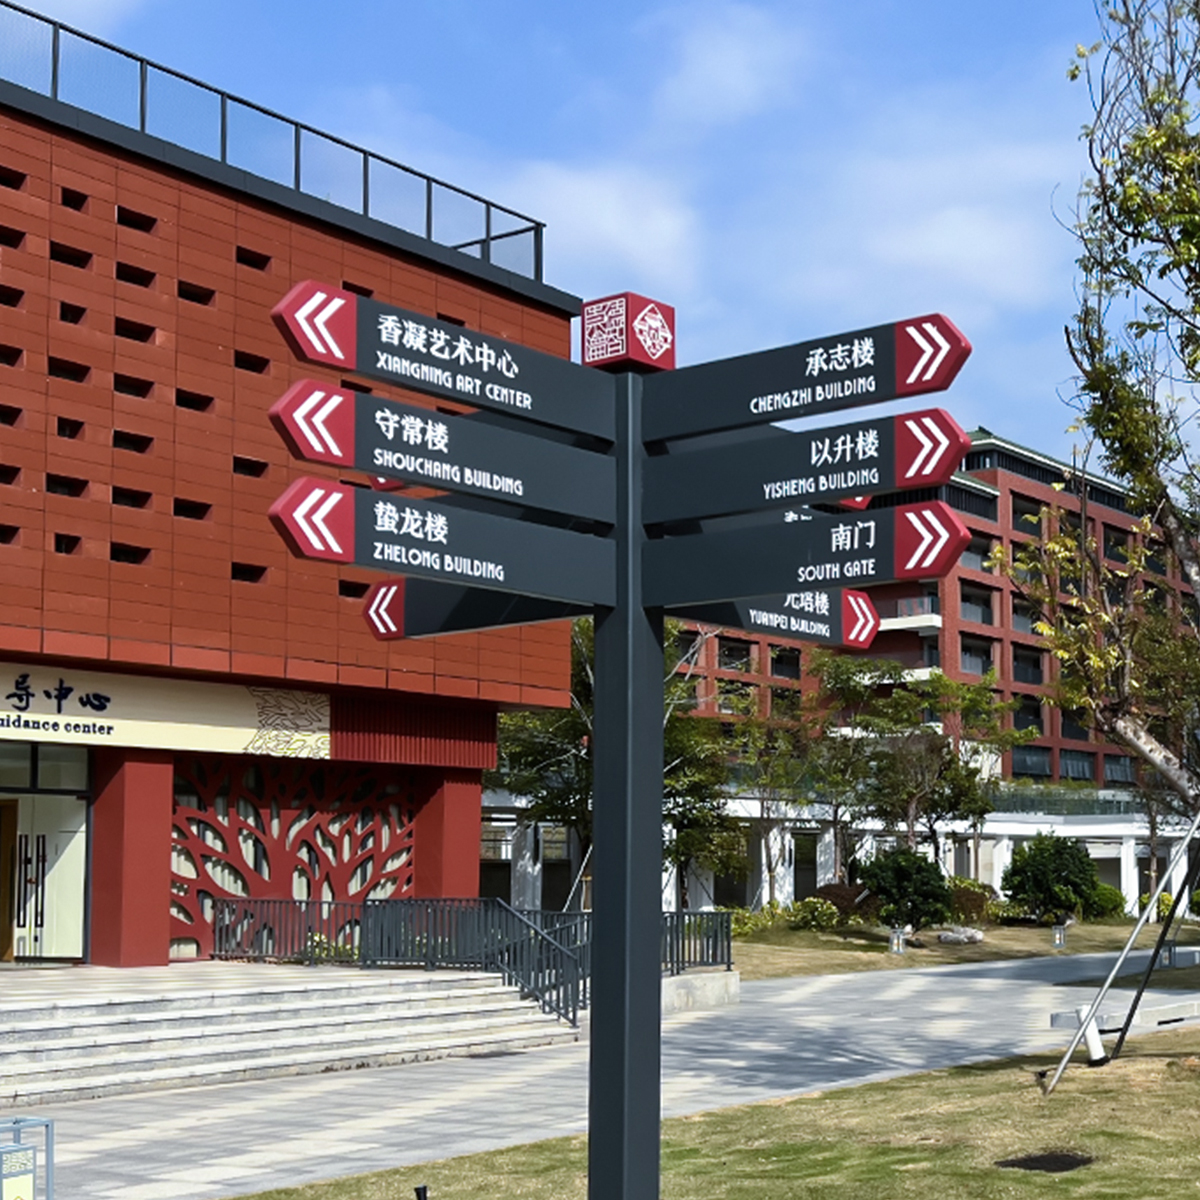
Data-first opening: why measured light matters
Design decisions for directional signage should begin with numbers. In a controlled lab environment, photometric analysis and lux mapping reveal how LED modules and optics interact with sign faces and mounting geometry—insights that retail spaces and public transport signage projects both rely on. Accurate illuminance maps reduce trial-and-error on site, cut installation time, and deliver consistent legibility under variable ambient conditions.

Core laboratory workflow for hotspot-free illumination
Start with a calibrated lux meter and a goniophotometer or an integrating sphere for source-level data. Capture beam angle, luminous intensity distribution, and initial luminance across the sign surface. Translate those measurements into a lux grid at the intended mounting distance, checking uniformity ratio and peak-to-valley contrast. Iteratively swap lenses, diffusers, or LED density until the lux distribution meets the target uniformity without a concentrated hotspot.
Case anchor: lessons from high-traffic transit upgrades
Transport upgrades for the 2012 London Olympics provide a practical anchor: planners prioritized measured lighting and legible wayfinding across crowded nodes. The result was fewer misreads at transfer points and clearer passenger flows. That real-world example shows how photometric methods scale beyond retail to bus bays and busy terminals—where durable housings and glare control are equally critical. For bus-specific contexts, consider how dedicated bus station signage standards intersect with lab-derived illumination targets.
Common mistakes that metrics expose
Design teams often default to higher overall lux to “fix” visibility problems; metrics reveal this as inefficient and glare-prone. Another common error is ignoring beam shaping—wide beams can wash surrounding surfaces while narrow beams create hotspots. Diffusers must be tested for spectrally consistent output; mismatched color temperature between sign and ambient light undermines perceived contrast. —A simple offset of a few degrees in mounting angle often resolves visible hotspots without changing fixtures.
Comparative findings: optics, spacing, and mounting geometry
Comparative trials usually show three levers with outsized impact: beam angle selection, lens diffusion, and standoff distance. Narrow beam with a high-quality diffuser yields tight contrast control; broader beams require careful spacing to preserve uniformity. When multiple fixtures illuminate one sign, staggering aim points reduces interference patterns and minimizes luminance peaks. Track these results with side-by-side lux maps for decisive selection.
Implementation checklist and validation steps
Use this checklist during lab and field validation:
– Capture source photometry (candela distribution) and convert to lux grids at planned distances.
– Target a uniformity ratio appropriate to task—directional copy needs higher uniformity than decorative elements.
– Verify color temperature consistency and measure luminance to ensure legibility under ambient glare.
– Perform a small on-site mock-up before large-scale rollout to confirm lab predictions under real ambient conditions.
Advisory close: three critical evaluation metrics
1. Uniformity Ratio (Max/Min lux): Aim for low variance across the sign face to avoid hotspots and preserve predictable legibility.
2. Peak Luminance and Glare Index: Keep peak luminance below thresholds that cause discomfort or wash out surrounding information panels.
3. Photometric Repeatability: Confirm that repeated measurements across production runs match lab baselines within acceptable tolerance—consistent beam angle and spectral output matter.
Measured photometry gives teams the confidence to specify fixtures, optics, and mounting that perform reliably in retail aisles and transit hubs. Practical results flow from disciplined measurement, iterative optics selection, and early on-site mock-ups—then the install is routine. Cosun Sign.—